O&K Print Watch – Viewing Printing Statistics
O&K Print Watch provides various reports for viewing statistics and printing history on any object (print server, printer, user, user group, or computer).
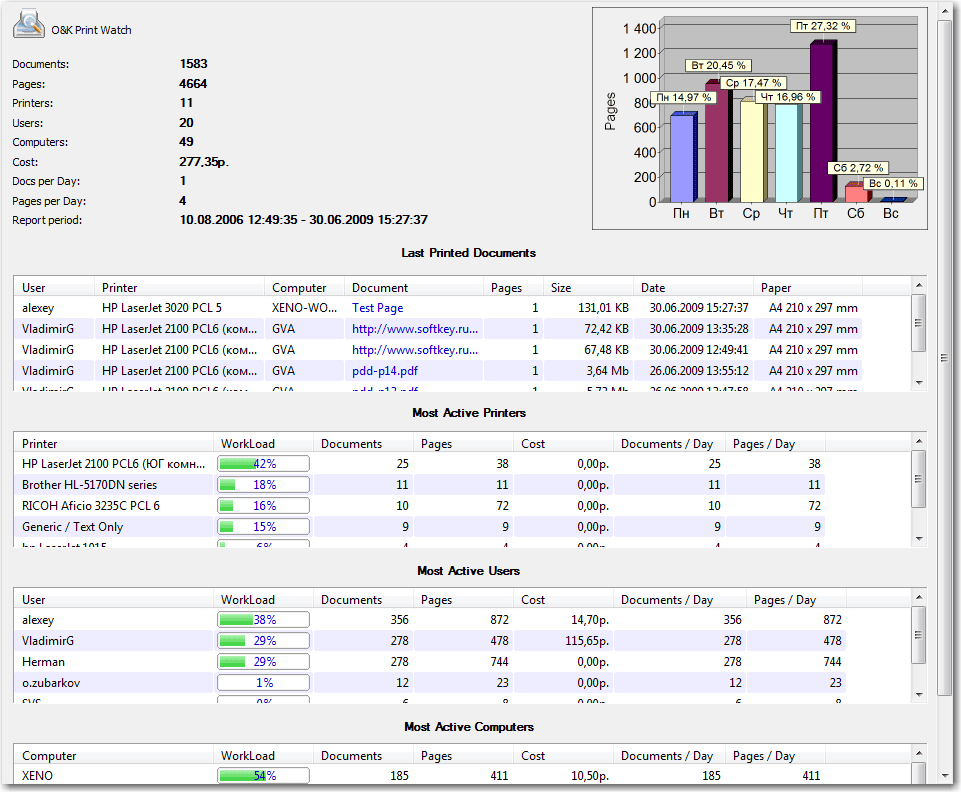
General printing statistics.
This report includes summary information on the object:
- The total number of documents printed.
- The total number of pages printed.
- The total number of printers used for printing.
- The total number of users who printed anything.
- The total number of computers from which the print jobs were sent.
- The total cost of documents printed.
- The average daily number of documents printed.
- The average daily number of pages printed.
- The statistics period.
- Distribution of documents, pages, and cost by weekdays, months, or years is presented as a chart.
- This report also includes information on the last printed documents for the object, and the most active users, printers, and computers.
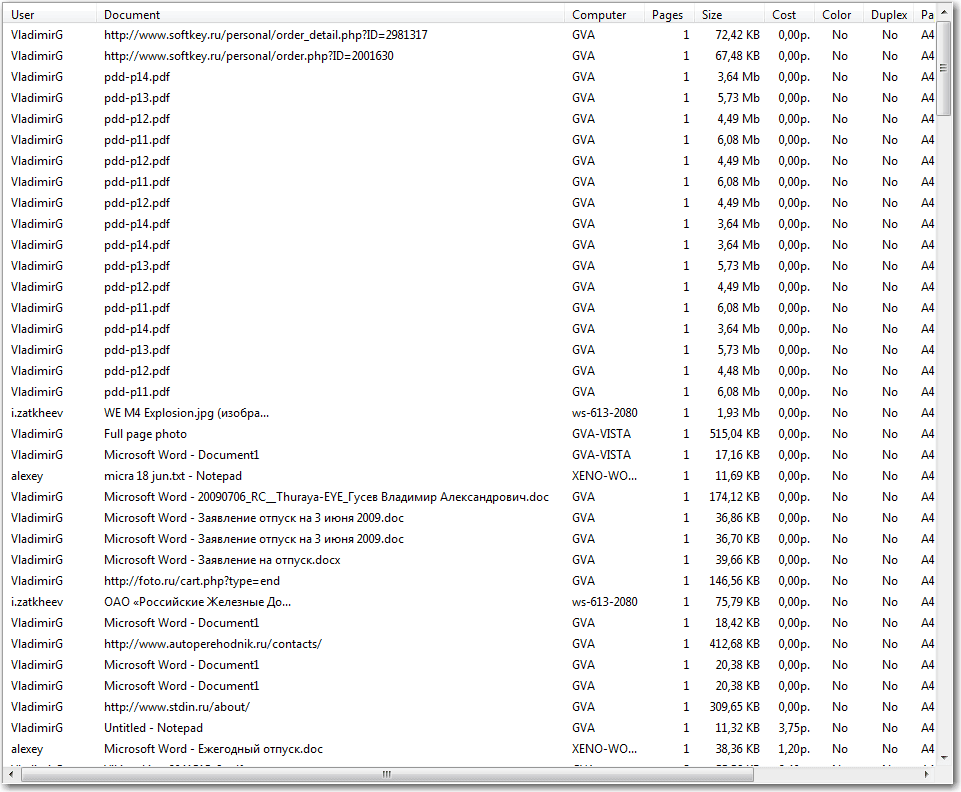
Detailed printing statistics.
This is a report on documents printed by a given object. To create this report, select the object in the tree on the left side of the program window, and select the Detailed tab. The report will be shown on the right.
The report contains the following fields:
- User — The name of the user who created the print job.
- Computer — The name of the computer where the print job was created.
- Printer — The name of the printer that printed the document.
- Document — The name of the document printed.
- Pages — The number of pages in the print job.
- Cost — The cost of the document printed.
- Size — The size of the print job in bytes.
- Date — The date and time of printing the document.
- Paper size — The paper size of the document.
- Color — Color printing mode.
- Duplex — Two-sided printing mode.
Printing history chart.
Distribution of documents, pages, and cost by weekdays, months, or years is presented as a separate chart.

Each chart has the following settings:
- Type — The type of chart.
- Show legend — Show/hide the legend.
- Group by — Group by pages, documents, or cost.
- Distribute — Distribute by hours, days of week, days of month, months, or years.
To update the report, select View → Update in the menu.
IMPORTANT: The statistics window is updated automatically. By default, the updating interval is 180 seconds. To change this value or completely disable automatic updating, select Tools → Auto Refresh in the menu.
Each report can be sorted by any field. To sort a report, click the header of the field by which you want the report to be sorted.
To search for a string in a report, use the Search right-click menu.
By default, each report is based on the last 1000 database entries. To change the reported period or the number of database entries for an object, select and right-click it in tree on the left side of the window, and then select Report → Parameters in the context menu. In this dialog, you can also set up filtering by document name, the number of pages, the cost of printing, paper size, color mode, or duplex mode.
IMPORTANT: To view the currently used statistics period or filter, click the respective button on the toolbar. To reset the period or filter, click the button again.